Introduction
In the DeviceConnect product, we encountered a recurring production issue where application memory usage would spike sharply over time. Eventually, the service would hit memory limits and require manual restarts to recover. This behavior was not aligned with traffic patterns and clearly indicated a memory management problem.
Our initial assumption, like most backend teams, was straightforward:
This must be a memory leak in our application code.
However, as this investigation unfolded, we learned an important lesson—not all memory leaks originate at the code level. In this article, I will walk through how we diagnosed the issue, why conventional heap profiling was not sufficient, and how switching the memory allocator ultimately resolved the problem.
What Is Memray
To validate whether the leak originated in our codebase, we started with memory profiling.
After evaluating several Python memory profilers, we shortlisted Memray, a high-performance memory profiler developed by Bloomberg. Memray provides:
- Precise tracking of Python heap allocations
- Native (C/C++) allocation visibility
- Low runtime overhead compared to traditional profilers
- Clear differentiation between heap usage and overall process memory (RSS)
Practical Challenge: Gunicorn + Multiple Workers
Our service runs behind Gunicorn with multiple workers, which complicates profiling:
- Memray cannot easily attach to all workers automatically
- Each worker is a separate process with its own memory space
The most reliable approach was to:
- Identify the process IDs of individual Gunicorn workers
- Attach Memray manually to each worker
- Collect allocation reports independently
While this setup was non-trivial, it gave us accurate, worker-level visibility.
How to install memray
pip install memrayFind gunicorn workers
ps -ef | grep gunicornAttach Memray to a Running Worker Process
memray attach <WORKER_PID> --output /tmp/memray-worker-<WORKER_PID>.binExample:
memray attach 12345 --output /tmp/memray-worker-12345.binResults from Memray
After running Memray under sustained load, the results were surprising.
- Heap size remained largely stable
- No unbounded growth in Python object allocations
- Garbage collection was functioning as expected
However, when we correlated this with system-level metrics, we observed something critical:
- Resident Set Size (RSS) was continuously increasing
- Memory was not being returned to the OS
- RSS growth did not correspond to heap growth
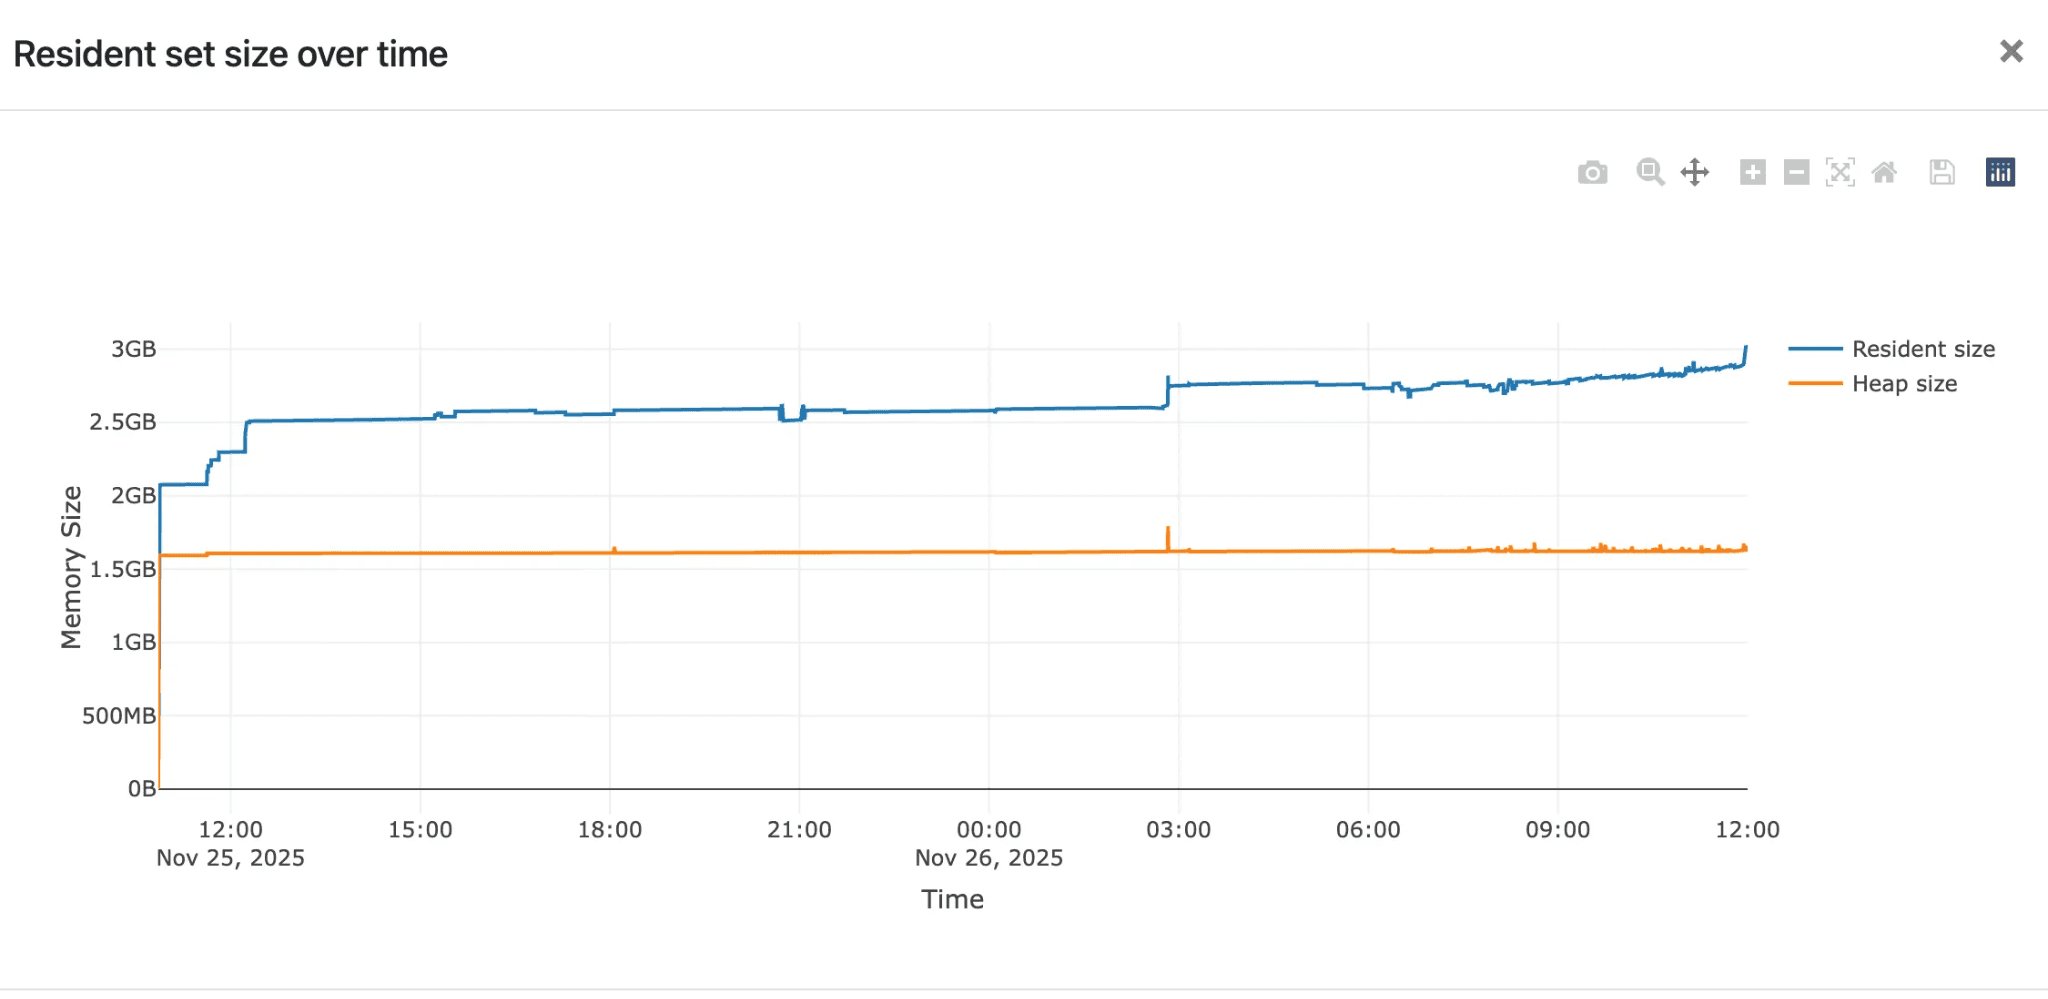
This behavior is clearly illustrated in the graph above:
- The heap size (orange line) remains flat
The RSS (blue line) steadily increases over time
Conclusion from Profiling
At this point, we ruled out:
- Python object leaks
- Reference cycles
- Application-level memory retention
The issue was below the Python runtime.
Understanding the Root Cause: glibc Memory Behavior
Python relies on the system C library (glibc) for memory allocation. While glibc is robust, it has known characteristics
- Memory arenas per thread/process
- Fragmentation under long-running workloads
Memory often not returned to the OS, even after being freed
This is not technically a “leak,” but from an operational perspective, it behaves like one.
Given our workload pattern—multiple workers, long uptime, bursty allocations—the default allocator was retaining memory and which was look as a memory leak.
How to install Jemalloc on ubuntu
Jemalloc is a high-performance memory allocator designed to reduce memory fragmentation and improve memory reuse compared to the default glibc allocator. It manages how applications allocate and release memory at the OS level, making it particularly effective for long-running, multi-threaded services. In Python applications, jemalloc is commonly used when heap usage remains stable but overall process memory (RSS) keeps growing, as it can return unused memory back to the operating system more predictably when properly configured.
a. Install jemalloc
sudo apt update
sudo apt install -y libjemalloc2
b. Verify Installation
ldconfig -p | grep jemallocExpected output (example):
libjemalloc.so.2 (libc6,x86-64) => /lib/x86_64-linux-gnu/libjemalloc.so.2c. Preload jemalloc (System-wide or per process)
export LD_PRELOAD=/lib/x86_64-linux-gnu/libjemalloc.so.2d. (Optional) jemalloc Custom Configuration
export MALLOC_CONF="narenas:1,tcache:false,dirty_decay_ms:10000,muzzy_decay_ms:10000,background_thread:true"e. Start Application (Example: Gunicorn)
gunicorn app:app --workers 12 --bind 0.0.0.0:8000f. Verify jemalloc Is Being Used
cat /proc/$(pgrep -f gunicorn |head -n1)/maps | grep jemallocExpected output contains:
libjemalloc.so.2Load Testing - Jemalloc with Default Settings
To address allocator-level behavior, we replaced the default allocator with jemalloc, a widely used alternative designed to reduce fragmentation.
We enabled jemalloc without any custom tuning and ran load tests.
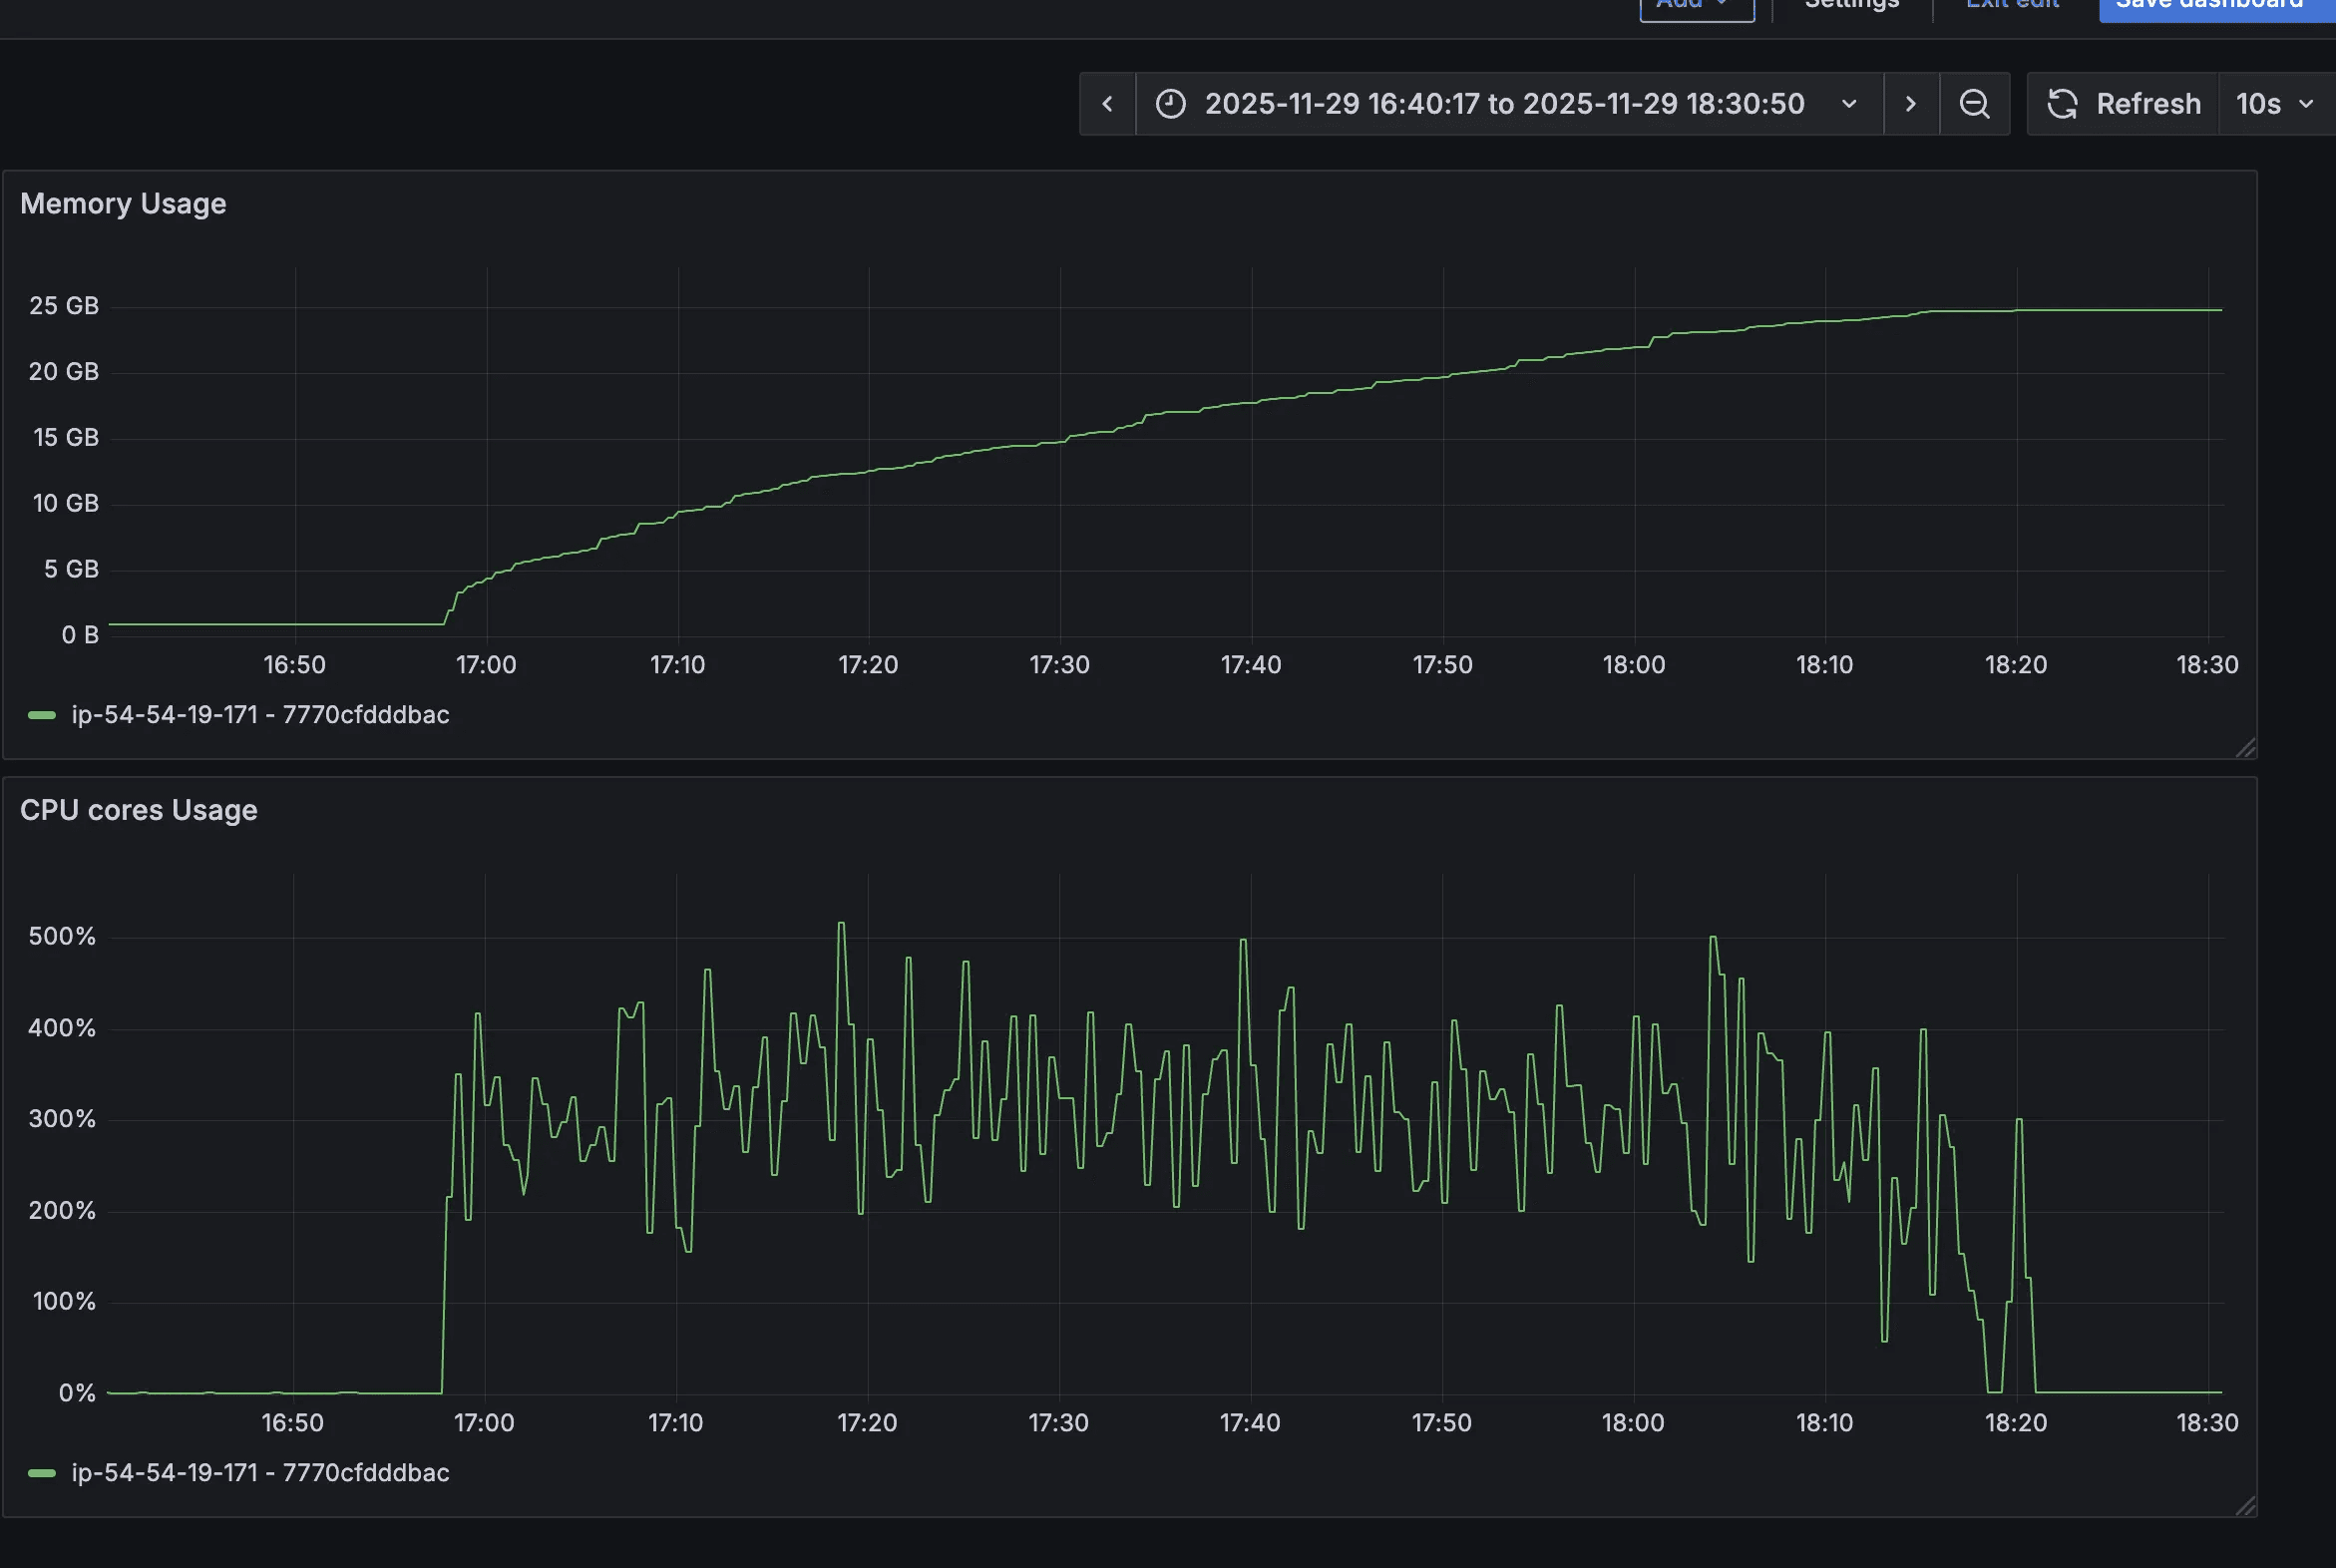
Observations
- Jemalloc was successfully loaded
- Memory usage increased significantly
- RSS reached nearly 25–30 GB
- Memory was still not released effectively
In fact, this was worse than the default allocator, where memory usage peaked around 11–17 GB.
This confirmed an important point:
Simply switching allocators is not sufficient—allocator configuration matters.
Load Testing - Jemalloc with Custom Settings
Next, we tuned jemalloc specifically for our workload and I ran load testing two times so that I can observe if there is any increment in memory for 2nd load test. As expected it was also stable during the second time also.
Configuration Used
ENV MALLOC_CONF="narenas:1,tcache:false,dirty_decay_ms:10000,muzzy_decay_ms:10000,background_thread:true"Why These Settings Matter
narenas:1
Reduces arena fragmentation in low-concurrency, multi-process setups.
tcache:false
Prevents per-thread caching from hoarding memory.
dirty_decay_ms / muzzy_decay_ms
Forces freed memory pages to decay and return to the OS within a bounded time.
background_thread:true
Allows jemalloc to reclaim memory asynchronously.
Results
The improvement was immediate and measurable:
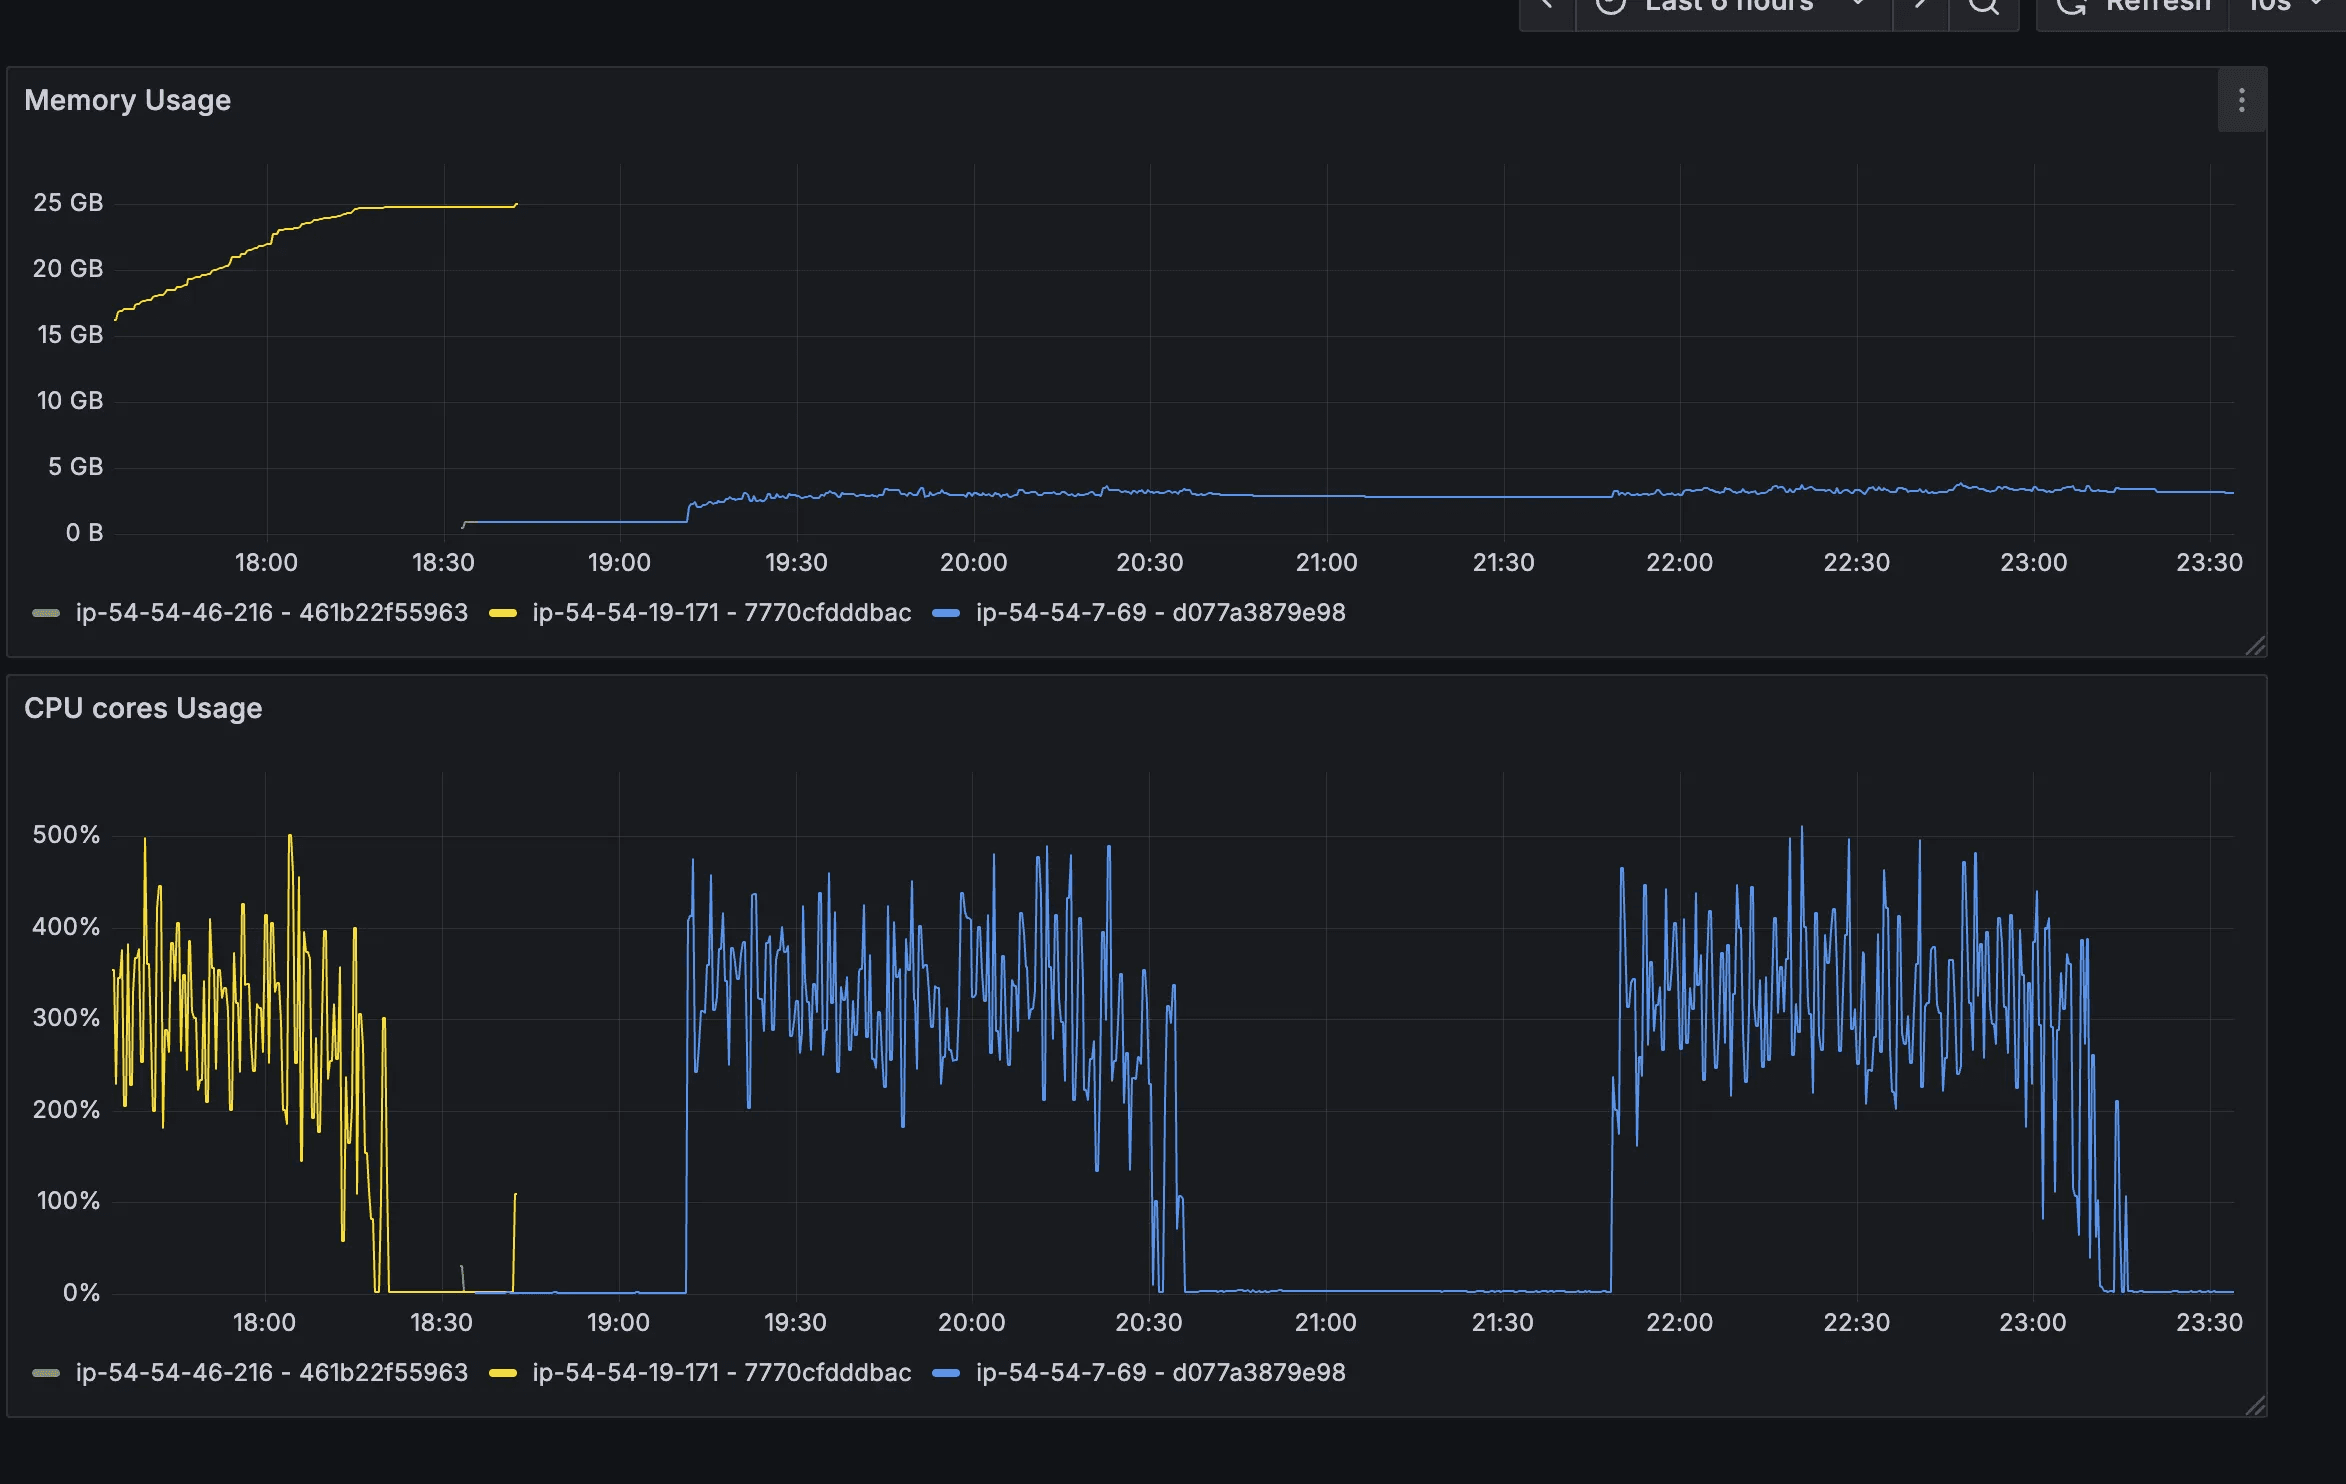
- RSS stabilized around 3 GB, even under load
- Memory usage decreased after load completion
- No manual restarts required
- Memory graphs became predictable and flat
This confirmed that the “leak” was allocator-level retention, not application leakage.
Additional Experiments: Uvicorn vs Gunicorn
We also evaluated different server configurations:
Uvicorn + jemalloc (custom config)
Stable memory behavior, higher baseline per worker, but predictable.
Uvicorn without jemalloc
Memory spiked to ~17 GB and did not recover.
Uvicorn + jemalloc (default config)
Worst behavior, memory exceeding 30 GB.
These experiments reinforced the conclusion that allocator tuning was the decisive factor, not the application server itself.
Conclusion
This investigation reinforced several important engineering lessons:
Not all memory leaks are heap leaks
Stable heap + growing RSS usually points to allocator or OS behavior.
Heap profilers alone are insufficient
Tools like Memray are essential to separate Python-level issues from system-level ones.
glibc memory retention can appear as leaks
Especially in long-running, multi-process Python services.
Jemalloc works—but only when tuned correctly
Default settings may worsen memory usage.
Allocator choice is a production concern
It should be tested, benchmarked, and documented like any other infrastructure dependency.
By combining Memray for diagnosis and jemalloc with tailored configuration for mitigation, we were able to permanently resolve the memory issue in DeviceConnect—without changing a single line of application code.